Description
Download Proof | Josh Aharonoff – CFO Excel Dashboard & Reporting (4.12 GB)
![]()
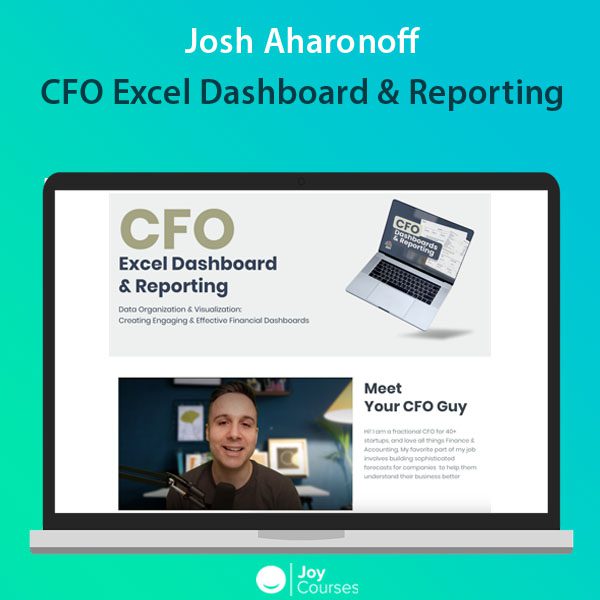
Josh Aharonoff – CFO Excel Dashboard & Reporting
Embark on a transformative journey to mastering financial reporting with Josh Aharonoff’s CFO Excel Dashboard & Reporting course. Tailored specifically for finance professionals, this course provides a comprehensive, step-by-step guide to creating executive-level financial dashboards and reports using Excel.
Getting Started: Introduction to Mastery
The course begins with an introductory module that sets the foundation for your learning journey, introducing the essential tech stack that will enhance your data management and reporting skills.
Organizing Your Data: The Foundation of Reporting
Learn how to organize your financial data efficiently, building your reports and dashboards on a solid and error-free foundation. Key takeaways include:
- Data overview and table creation, with insights into financial contexts.
- Advanced PowerQuery techniques for data transformation.
Creating Summarized Financials Report: The Core of Finance
Master the creation of summarized financial reports, an essential skill for CFOs:
- Set accurate dates for financial reporting.
- Create detailed profit and loss statements, balance sheets, and cash flow reports.
- Customize report periods and sections.
- Analyze period-over-period changes for actionable insights.
Creating Dashboards: Visualization of Success
Learn to present financial data in a compelling way using Excel dashboards:
- Prepare your data for dashboard creation with advanced Excel functions.
- Design date selectors and craft your first Key Performance Indicator (KPI).
- Build a full KPI dashboard with dynamic graphs and spill arrays for interactive reporting.
- Compare Budget vs. Actuals using easy-to-follow chart creation tutorials.
Advanced Dashboard Techniques: Elevating Your Reporting
Take your dashboards to the next level with advanced techniques, focusing on management reporting:
- Create a professional cover page in Excel.
- Use PivotTables and Pivot Charts for dynamic dashboards.
- Build a Break Even Dashboard to visualize key financial thresholds.
- Develop a Spotlight Dashboard to highlight critical data points and trends.
Final Touches: Polishing Your Financial Reporting Skills
Conclude your learning with tips to refine your financial reporting skills, ensuring you’re ready to step into the role of a strategic CFO confidently.
Benefits for Students:
- Transform raw data into visually compelling and strategic financial reports.
- Enhance decision-making with accurate, interactive financial data.
- Become proficient in Excel for sophisticated financial modeling.
- Join a community of finance professionals dedicated to continuous learning.
This course equips you with the tools to become an indispensable asset to your organization, capable of delivering clear, concise, and impactful financial insights.


